Mapbox
Learn more about integrating Leaflet.js and MapBox with Volt Dashboard
Getting started
In order to get started using the Mapbox integration you will first need to create an account on Mapbox.
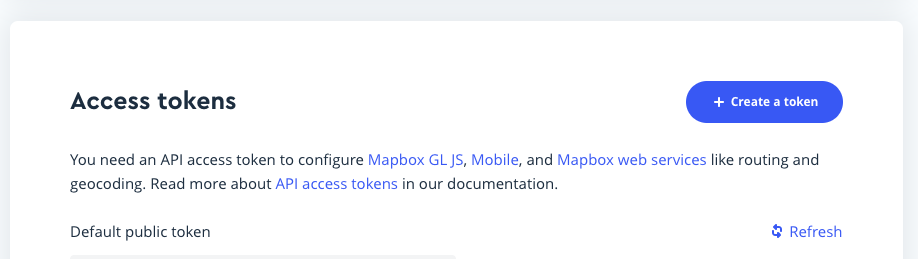
After you finished creating an account, from your main dashboard you will need to create an API key. Click on the + Create a token button and follow the instructions to generate your API key.
After you have succesfully created your own token, you will need to update the spaces.js file to use your own:
var config = {
    mapboxToken: 'YOUR_MAPBOX_TOKEN_HERE',
    mapboxId: 'mapbox/light-v10' // this is the styling
};
Initializing your map
Spaces uses Leaflet.js to manipulate the Mapbox API. In order to initialize a map, all you need to do is to include the following CSS and Javascript files:
Include leaflet.css before the end of your <head> tag:
<!-- Leaflet CSS -->
<link type="text/css" href="@@path/vendor/leaflet/dist/leaflet.css" rel="stylesheet">
Include leaflet.js file before the end of your <body> tag:
<!-- Leaflet JS -->
<script src="@@path/vendor/leaflet/dist/leaflet.js"></script>
Then in your html file you need to create a div tag with an id attribute:
<div id="mapListings"></div>After that in your Javascript files you’ll need to initialize the map like this:
var mapListings = L.map('mapListings').setView(baseLatLng, zoom);
L.tileLayer('https://api.mapbox.com/styles/v1/{id}/tiles/{z}/{x}/{y}?access_token={accessToken}', {
attribution: 'Map data © <a href="https://www.openstreetmap.org/">OpenStreetMap</a> contributors, <a href="https://creativecommons.org/licenses/by-sa/2.0/">CC-BY-SA</a>, Imagery © <a href="https://www.mapbox.com/">Mapbox</a>',
maxZoom: 18,
id: YOUR_MAPBOX_ID,
accessToken: YOUR_MAPBOX_TOKEN
}).addTo(mapListings);
Of course with Spaces you already have all of this done. This guide is only here to show you what you have to do if you want to set it up yourself. You can learn more about what you can do with the map by reading the full Leaflet.js docs.
Default location
To set the default location view you will need to update the following latitude and longitude values within the spaces.js file:
var baseLatLng = [37.57, -122.26];
Default zoom
In order to set the default zoom you will need to update the following value in the spaces.js file:
var zoom = 10;
Listing items
To add, update or remove a listing item from the map you will need to add an object with the following format to the listings variable.
var listings = [
        {
            url: '#',
            latLng: [37.70, -122.41],
            name: 'Call with Jane',
            date: 'Tomorrow at 12:30 PM'
        },
        {
            url: '#',
            latLng: [37.59, -122.39],
            name: 'HackTM conference',
            date: 'In about 5 minutes'
        }
]
Of course you can change the variable name and even add or remove certain data by editing the following code:
$.each(listings, function(index, listing) {
    var popupHtml = `
        <a href="${listing.url}" class="card card-article-wide flex-column no-gutters no-hover">
            <div class="card-body py-0 d-flex flex-column justify-content-between col-12">
                <h4 class="h5 font-weight-normal mb-2">${listing.name}</h4>
                <span class="font-xs text-dark">${listing.date}</span>
            </div>
        </a>
    `;

    var marker = L.marker(listing.latLng, { icon: icon }).addTo(mapListings);
    marker.bindPopup(popupHtml);
});
As you can see, the markup for the card when you click on a marker is inside the popupHTML variable. You can change the HTML tags and what you want to show from the listings array here.
Changing the marker icon
For Spaces we chose a marker icon with the secondary color of the theme. But if you integrate Spaces with your own branding colors, you may need to change the aspect of the markers. Change the following options with your own preferences.
Notice we use a marker.svg icon. If you want, you can also just change the fill attribute color inside the marker.svg file to update the marker color:
var icon = L.icon({
    iconUrl: '../../assets/img/marker.svg',

    iconSize:     [38, 95], // size of the icon
    shadowSize:   [50, 64], // size of the shadow
    iconAnchor:   [22, 94], // point of the icon which will correspond to marker's location
    shadowAnchor: [4, 62],  // the same for the shadow
    popupAnchor:  [-3, -76] // point from which the popup should open relative to the iconAnchor
});
Mapbox styles
One of the advantages of Mapbox is that you can use your own or predefined styling to make the map dark, show only the terrain or many more. Here’s how you can easily change the aspect of your map:
You can check out all of the predefined styles for Mapbox from here.
To change the style of the map change the mapboxId attribute with the following available styles:
- mapbox/dark-v10
- mapbox/light-v10
- mapbox/streets-v11
- mapbox/outdoors/v-11
- mapbox/satellite-streets-v11
This is based on the URL you can when clicking on the preview link from Mapbox.
var config = {
    mapboxToken: 'pk.eyJ1Ijoiem9sdGFudGhlbWVzYmVyZyIsImEiOiJjazZqaWUwcWswYTBvM21td2Jmcm5mYmdyIn0.7_5YCbbOFRnvqZzCNDo9fw',
    mapboxId: 'mapbox/light-v10'
};